✨ Prometheus Monitoring Tutorial

In this post, I will walk you through creating a simple Prometheus monitoring stack, connecting it to Grafana for pretty dashboards, and finally configuring alerts via PagerTree.
If you would like a video to follow along instead, you can see it on YouTube. You can find all the code for this stack on Github.
Setup Docker Environment
The first thing we’ll do is a machine up and running for this solution. This tutorial assumes you will be using Ubuntu 16.04.
I like Digital Ocean for small tutorials like this one.
If you don’t already have an account, use this link to create an account and get $10 in credits.
If you don’t know how to create a Digital Ocean droplet or SSH into the machine you can follow this article on Medium.
Build the Prometheus Stack
Once you’ve created the Ubuntu server, run the following command in the shell terminal:
curl https://raw.githubusercontent.com/PagerTree/prometheus-grafana-alertmanager-example/master/install.sh -H 'Cache-Control: no-cache' | sudo sh; cd prometheus-grafana-alertmanager-example;
At this point you’ll have automagically deployed the entire Prometheus, Grafana, and Alert Manager stack. You can now access the Grafana dashboard from your browser at:
- Address:
http://<Host IP Address>:3000 - Username:
admin - Password:
9uT46ZKE
Add the Prometheus Datasource to Grafana
Since the release of Grafana 5.x, Grafana supports auto provisioning data sources and dashboards. We’ve updated the repo for Grafana to auto provision the Prometheus data source and dashboards. Please continue to the next section, Grafana Dashboards.
Grafana Dashboards
Awesome! Now if you navigate to the Dashboards in Grafana you will see data populating and some nice looking graphs.
At this point you’ll then 2 dashboards. They are pretty cool. Check them out. When your ready, head down to the Configure Alerts Section.
Ping Dashboard
This dashboard monitors a couple websites for uptime.
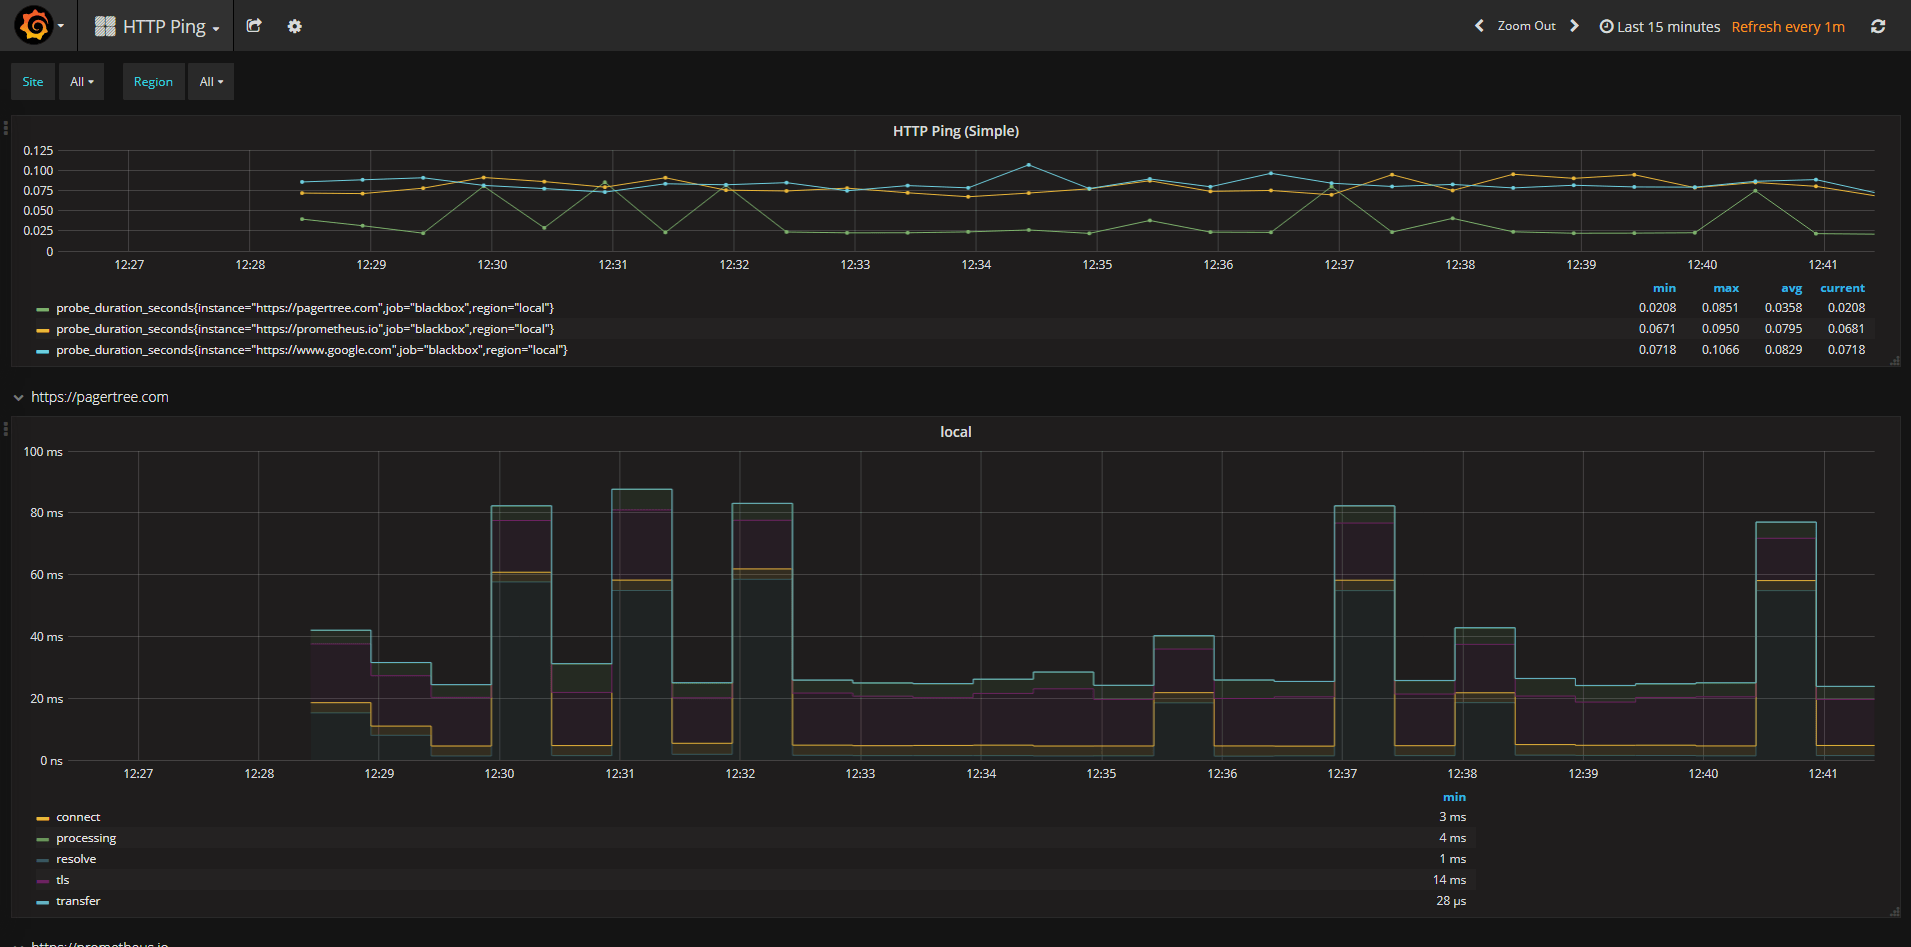
Ping Dashboard
System Monitor Dashboard
This dashboard monitors the load on the machine that is running your Prometheus stack.
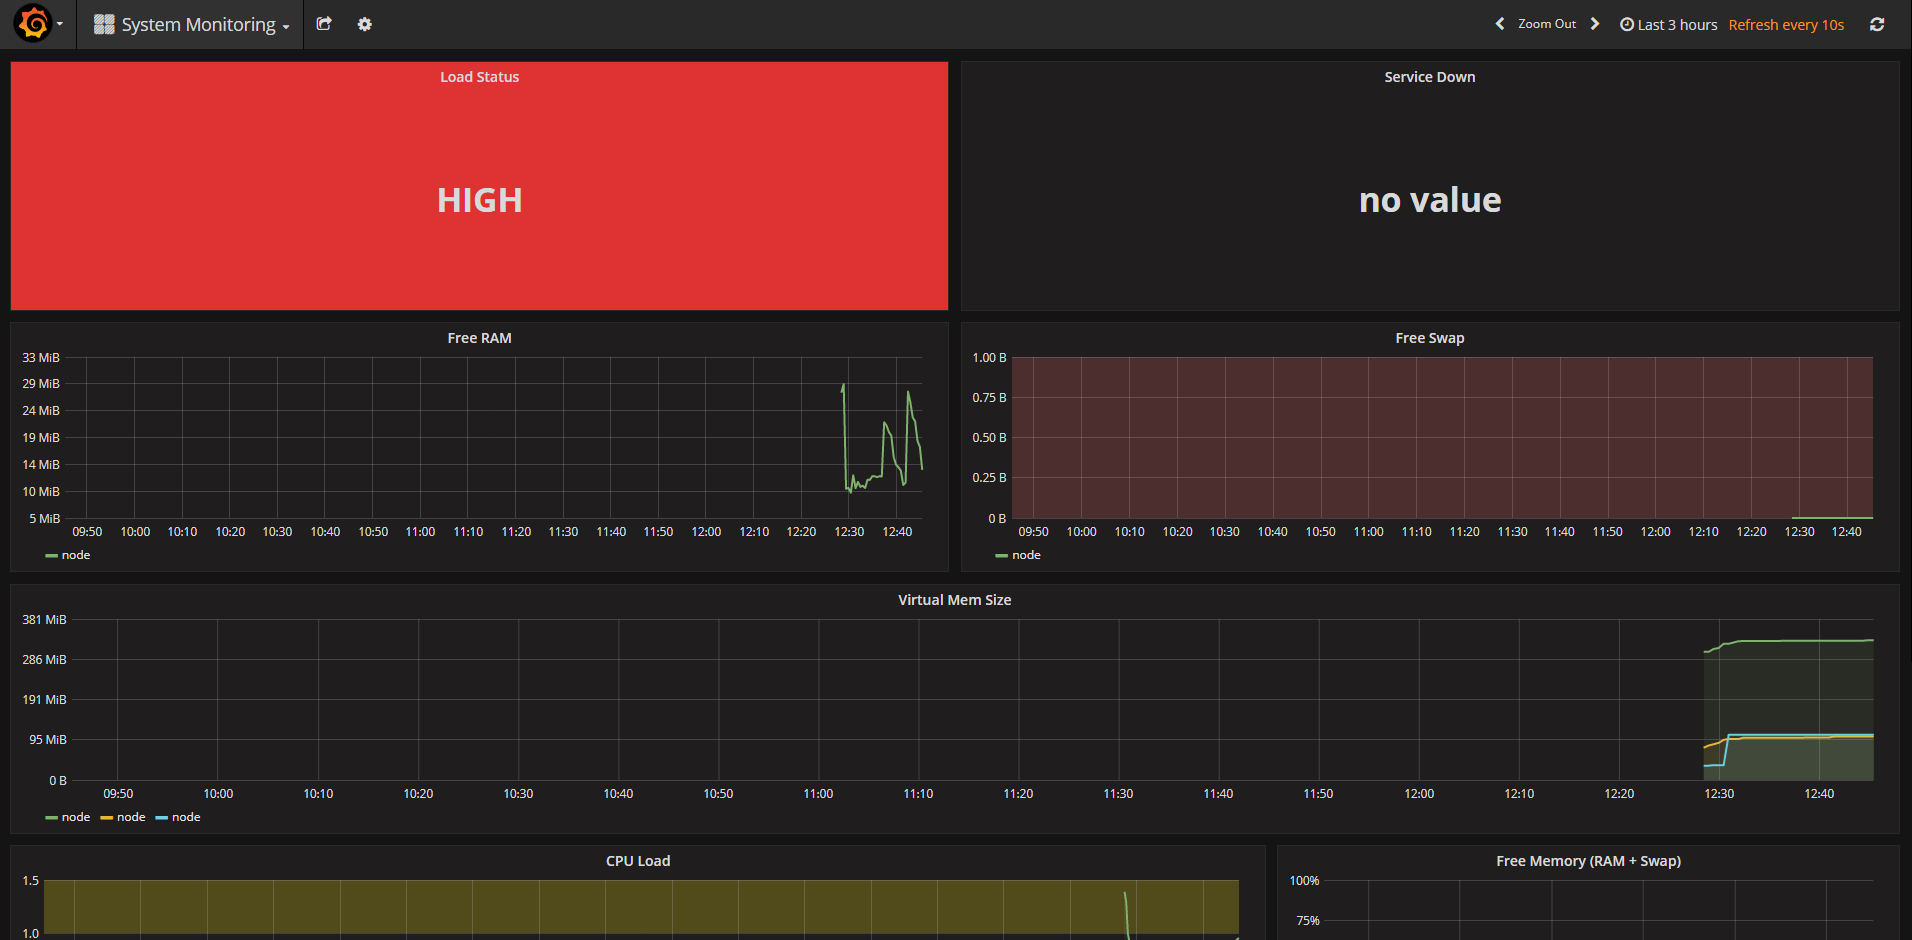
System Dashboard
Configure Alerts
Now while the dashboards are cool, it would be even cooler if we were able to get alerted when something went wrong. Luckily for us, this project will create an alert after 30 seconds of high CPU. So let’s try to make use of it.
Create a Prometheus Integration in PagerTree
-
Create a new integration.
-
Click the Prometheus Logo.
-9fd17b77d288c5ea310a1dd1708d1686.png)
-
Fill out the following:
- Name
- Appropriate urgency for the Prometheus alerts
- A team alerts from Prometheus should be assigned to
-
Click Create button
-
Copy the endpoint URL
-1e0d3d1b5c066b0512ea6ee2a547b1a8.png)
Ensure that for the team you are assigning alerts to, you are the Layer 1 on-call and that you have at least 1 notification method setup.
Modify the Alert Manager Configuration
Now we want to modify the alert manager configuration to make use of our PagerTree Webhook. Run the following command and make sure to replace <Your PagerTree Webhook URL> with the you copied.
./util/alertmanager-configure-pagertree.sh <Your PagerTree Webhook URL>;
After you have run the configuration script, restart the stack with the following command:
Sometimes this command fails. If it does, just run the command again.
Simulate an Alert Worthy Incident
In order for us to get an alert we’ll wan to simulate some sort of Alert Worthy Incident. From the shell terminal, run the following command:
./util/high-load.sh;
Now we’ll wait for 30 seconds or so, and if you’ve followed all the steps correctly you should get a notification saying something like Instance {{ $labels.instance }} under high load.
Congrats! You’re done!
If you are reading this give yourself a pat on the back. Good job! You’ve successfully deployed a Prometheus monitoring system, hooked it up to Grafana, and configured and alerts to go to your PagerTree account.
This project is intended just to be a quick tutorial. Before being production worthy, several security considerations should be implemented.