Overview
What is Prometheus?
Prometheus is an open-source systems monitoring and alerting toolkit. It is designed to monitor the health and performance of systems and applications in dynamic cloud-native environments.
Prometheus collects metrics data from targets, such as servers, containers, databases, or even applications instrumented with Prometheus client libraries. Metrics are identified and organized by key-value pairs called labels. Metrics can then be queried using Prometheus Query Language (PromQL), which is then used by other systems like Grafana for visualization or Alert Manager for alerting and notifications.
Prometheus is widely recognized for its simplicity, reliability, and scalability, making it a popular choice for monitoring modern infrastructure. Its active community and ecosystem of exporters and integrations further contribute to its appeal as a comprehensive monitoring solution for today's dynamic IT environments.
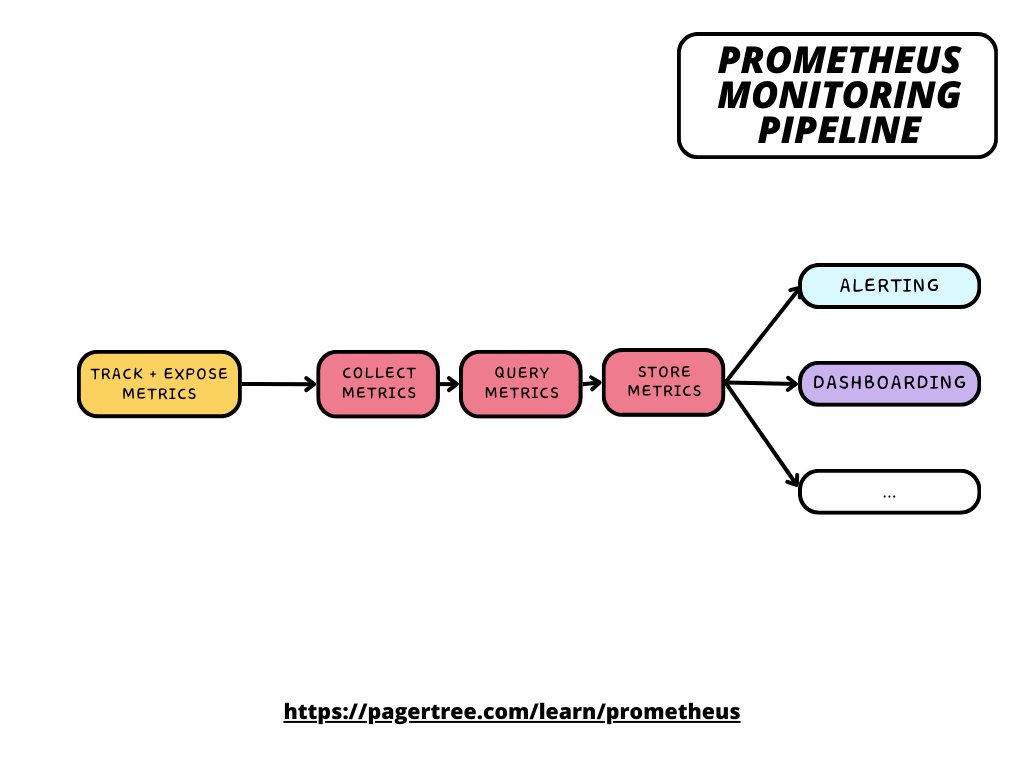
Prometheus Monitoring Pipeline
Features
Prometheus boasts many features that make it a powerful monitoring and alerting tool for modern infrastructure. Here are some key features:
Time Series Data Collection: Prometheus collects time-series data, which is crucial for monitoring the behavior of systems and applications over time.
Multi-dimensional Data Model: Metrics in Prometheus are identified using key-value pairs called labels. This multi-dimensional data model allows for flexible and efficient querying and aggregation of metrics.
PromQL: Prometheus Query Language (PromQL) is a powerful query language that enables users to perform complex queries on collected metrics data. PromQL allows for tasks such as metric selection, filtering, aggregation, and mathematical operations.
Alerting: Prometheus features a built-in alerting system that allows users to define alerting rules based on specific conditions and thresholds. When these conditions are met, Prometheus can trigger alerts, notifying users or external systems via various channels such as email or webhooks.
Service Discovery: Prometheus supports service discovery mechanisms that automatically discover and monitor targets in dynamic environments. This includes integrations with Kubernetes, Consul, and other service discovery systems, as well as static configuration options.
Scalability: Prometheus is designed to be highly scalable and capable of handling large volumes of metrics data across distributed environments. It supports horizontal scalability through federation, allowing multiple Prometheus servers to collaborate and aggregate metrics data from different sources.
Data Retention and Storage: Prometheus offers configurable retention periods for stored metrics data, allowing users to define how long data should be retained for analysis and alerting purposes. It stores data locally in its time-series database, making it easily accessible for querying and visualization.
Exporters and Integrations: Prometheus has a rich ecosystem of exporters and integrations that allow users to monitor a wide range of systems and applications. Exporters are agents or libraries that expose metrics in a format that Prometheus can scrape, enabling monitoring of third-party services, databases, and custom applications.
Grafana Integration: Prometheus integrates seamlessly with Grafana, a popular open-source visualization tool. Grafana allows users to create customizable dashboards and visualizations of Prometheus metrics data, enabling detailed monitoring and analysis.
Architecture
Prometheus follows a "pull-based" model. It periodically "scrapes" metrics from configured targets, stores them in its time-series database, allows querying and visualization of metrics data, and supports alerting based on defined rules.
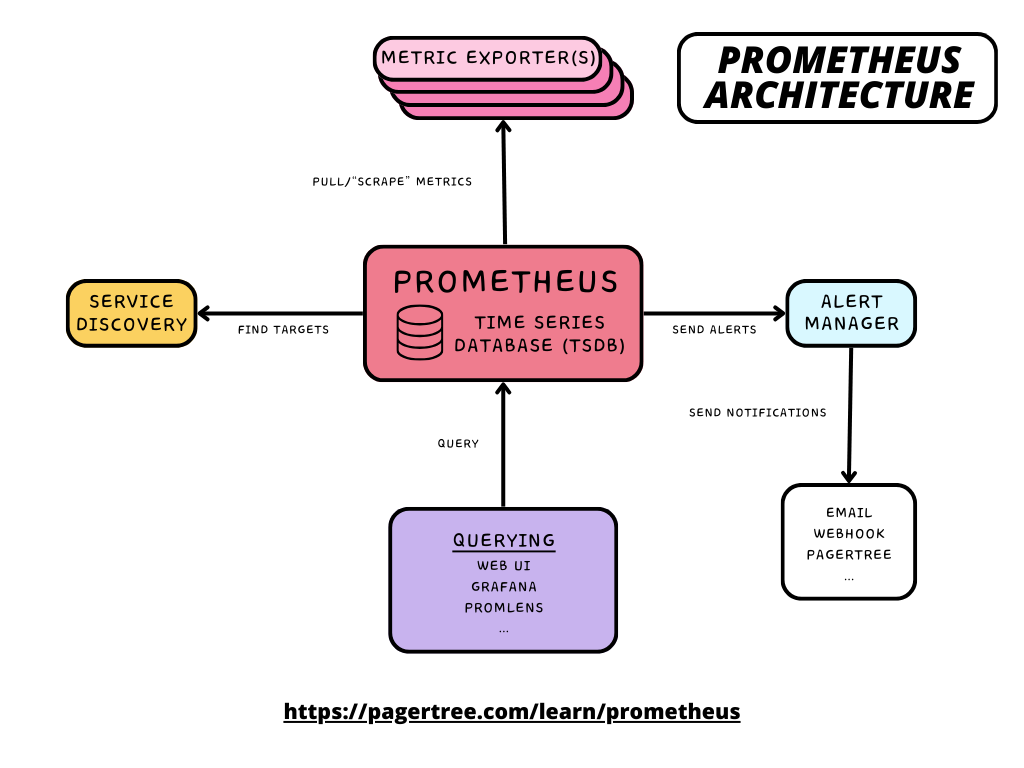
Prometheus Architecture
Components
- Prometheus Server: The core component that collects and stores time-series data based on metrics scraped from instrumented targets. It includes a time-series database (TSDB) for storing metrics data.
- Prometheus Configuration: Administrators configure Prometheus to scrape specific targets for metrics data. This configuration includes details such as scrape intervals, targets, and other settings.
- Service Discovery: Prometheus supports various service discovery mechanisms, such as static configurations, DNS-based discovery, Kubernetes service discovery, etc., to dynamically discover and monitor targets.
- Exporters: Exporters are agents that run alongside services or systems to expose metrics in a format that Prometheus can scrape.
- Pushgateway: In scenarios where direct scraping is not feasible (e.g., short-lived jobs), the Pushgateway allows applications to push metrics to Prometheus, which are then scraped by the Prometheus server.
- Alertmanager: This component handles alerts generated by Prometheus. It manages the routing, grouping, and notification of alerts to various integrations such as email and webhooks.
- Visualization and Querying: Prometheus provides a built-in expression browser for querying and graphing metrics data. However, it can also integrate with visualization tools like Grafana for more advanced visualization and dashboarding capabilities.
Use Cases
When to use Prometheus?
- Multi-Dimensional Numeric Time Series: Prometheus is particularly well suited for recording multi-dimensional numeric time series.
- Monitoring Distributed or Cloud Native Applications: Prometheus is well suited for monitoring containerized environments like Kubernetes. Its service discovery mechanisms make it easy to monitor dynamic systems. Its querying and alerting functionality can notify you when your RED/USE metrics begin to breach thresholds.
- Reliability: Prometheus is distributed as a single binary with no dependencies, making it very reliable, even when other parts of your infrastructure are down.
When not to use Prometheus?
- Require 100% Accurate Metrics: Because of server restarts and the way Prometheus pulls/"scrapes" data, some metrics may be lost. Use cases like "per-request billing" are unsuitable for Prometheus.
- Logging or Tracing: Prometheus exclusively deals with numeric metrics. A logging solution like Loki is better suited for logs.
- Machine Learning or AI-based anomaly Detection: Prometheus supports basic alerting and aggregation, but other tools will offer more advanced analytics capabilities.
- High Cardinality Metrics: If your monitoring requirements involve a very high number of unique metric dimensions or labels (known as high cardinality), Prometheus may struggle to handle the volume efficiently. In such cases, other solutions like Thanos or Cortex, which are designed for handling high cardinality data, might be more appropriate.
- Long-Term Data Storage: While Prometheus is excellent for real-time monitoring and short-term analysis, it's not optimized for long-term data retention. If your use case requires storing metrics data for extended periods (months or years), you might need to integrate Prometheus with long-term storage solutions like Thanos, Cortex, or remote storage backends.
FAQ
Prometheus doesn't scale
This is mostly a marketing claim. You can reliably run Prometheus with tens of millions of active series. If you need more than that, there are several options for scaling and federating Prometheus.
Here is a good blog post debunking the scalability of Prometheus.
How does Prometheus handle server restarts?
The rate() function will automatically handle server restarts ("counter resets"). Check out the counter resets section, where we discuss how values after a reset are adjusted for resets.
Which metrics should be used with a rate and irate functions?
rate() and irate() must be passed a range vector and operate on the counter and histogram datatypes.
Which metrics cannot be averaged across a cluster?
The summary data type metric cannot be averaged across a cluster. Summaries are computed on the metric producer and cannot be averaged on the Prometheus server.