Docs
WebsiteLoginFree Trial
  • Getting Started
    • OnCall Users
    • Team Admins
    • Account Admins
  • Architecture Guide
  • Common UI Design Patterns
  • Alerts
  • Teams
  • Schedules
  • Escalation Policies
  • Integrations
  • Broadcasts
  • Users
  • Notifications
  • Reports
  • Billing
  • Accounts
  • Stakeholders
  • Maintenance Windows
  • Routers
  • Notification Rules
  • Single Sign On (SSO)
  • Integration Guides
    • Introduction
    • 66uptime
    • Apex Ping
    • AppDynamics
    • Auvik
    • AWS CloudWatch
    • Azure Monitor
    • Cloudflare
    • Cronitor
    • Datadog
    • Dead Man's Snitch
    • Echoes HQ
    • ElastAlert
    • Email
    • Form
    • Freshdesk
    • Freshservice
    • Google Hangouts Chat
    • Grafana
    • Healthchecks.io
    • HetrixTools
    • Honeybadger
    • Hydrozen
    • Jira Server
    • JotForm
    • Kapacitor
    • LogicMonitor
    • Mattermost
      • Outgoing Webhook
      • Post to Channel
    • Meta Workplace
    • Microsoft Teams
    • New Relic
    • Outgoing Webhook
    • Pingdom
    • Prometheus
    • PRTG Network Monitor
    • Pulsetic
    • Sentry
    • ServerGuard24
    • Site24x7
    • Slack
      • Notifications
      • Outgoing Webhook
      • Post to Channel
    • SolarWinds
    • Stackdriver
    • StatusCake
    • Twilio
      • Incoming SMS
      • Live Call Routing
    • Typeform
    • Uptime
    • Uptime Kuma
    • UptimeRobot
    • Webhook
    • Zendesk
  • API
    • Introduction
    • Authentication
    • Errors
    • Pagination and Filters
    • Common Model Attributes
    • Account Users
    • Alerts
    • Broadcasts
    • Comments
    • Escalation Policies
    • Events
    • Integrations
    • Logs
    • Maintenance Windows
    • Notification Rules
    • Routers
    • Schedules
    • Teams
    • Users
  • Command Line Interface (CLI)
    • PagerTree CLI: Command Line Interface
Powered by GitBook
On this page
  • Common Filters
  • Export to CSV
  • Alerts Report
  • Teams Reports
  • Users Reports
  • Notifications Report

Was this helpful?

Reports

Reports can give you a "big picture" overview on how your users, teams, and company is performing.

PreviousNotificationsNextBilling

Last updated 1 year ago

Was this helpful?

Common Filters

  • Start time - The start datetime to consider (inclusive).

  • End time - The end datetime to consider (inclusive).

  • Time zone - The time zone to report in.

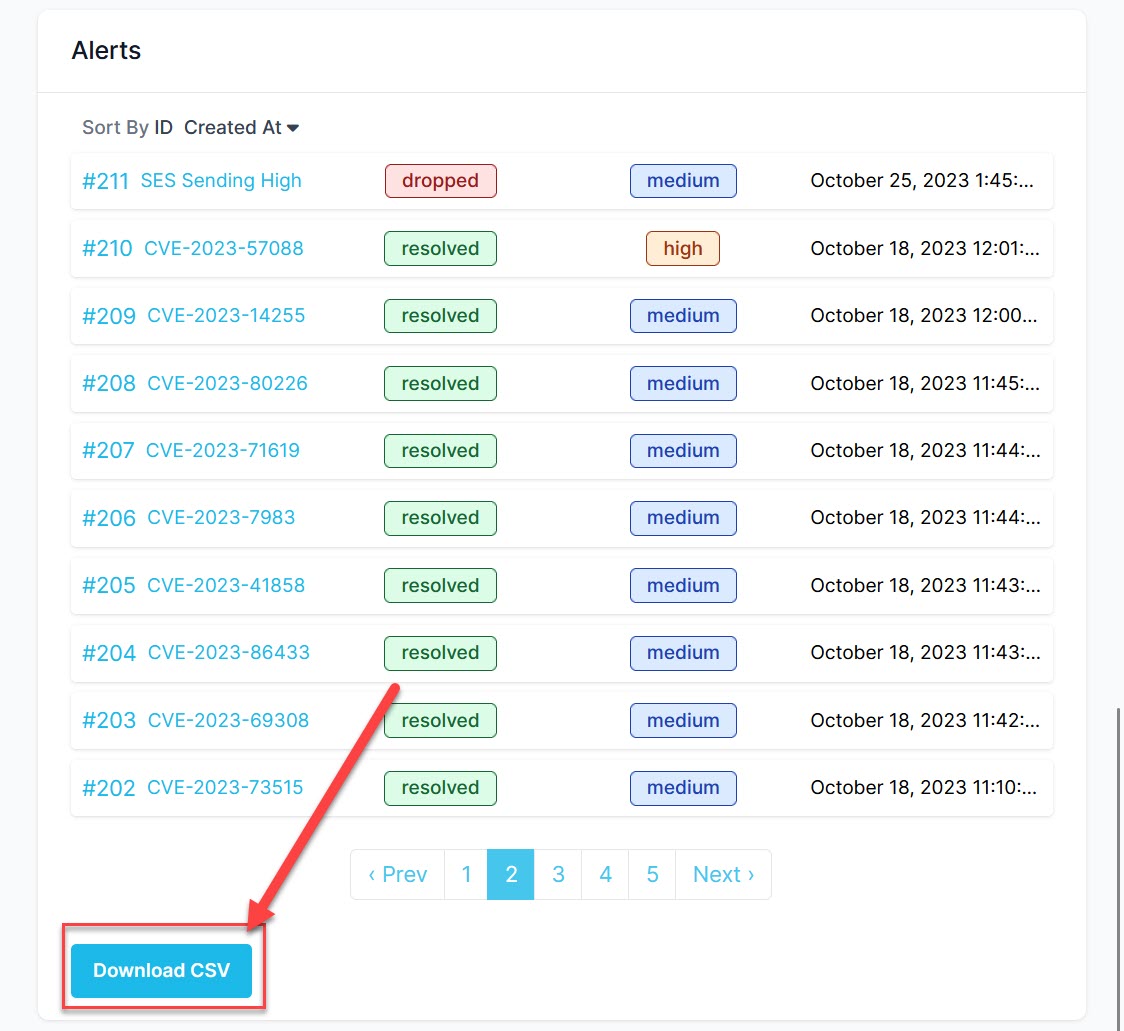
Export to CSV

Report data can be exported to CSV format. To export your data:

  1. Filter your data.

  2. Click the Download CSV button.

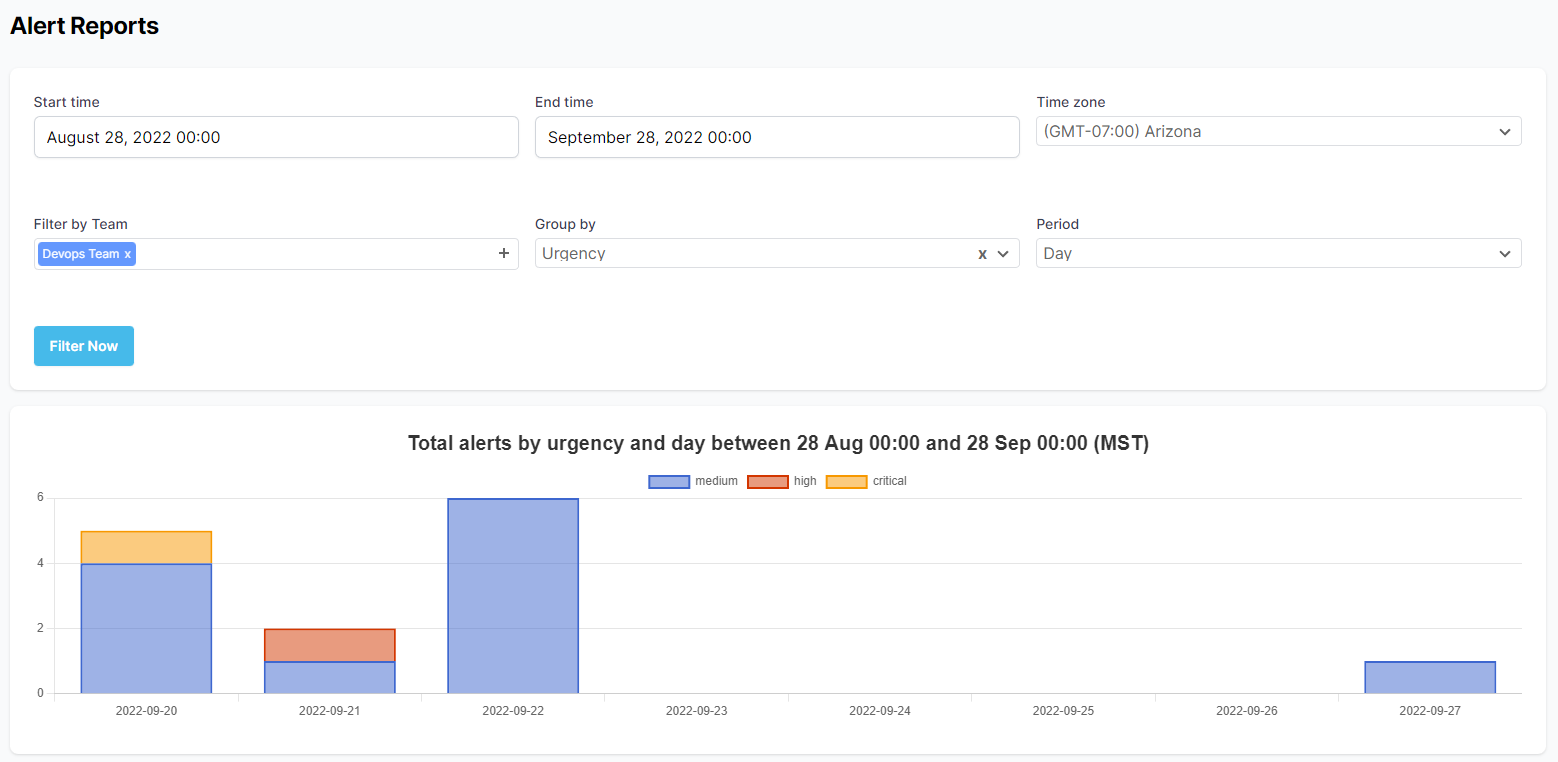
Alerts Report

Additional Options

  • Filter by Team - Filter by selected teams (leave blank for all).

  • Group by - Options: urgency, status, source, team.

  • Period - Unit of time bucket the x-axis.

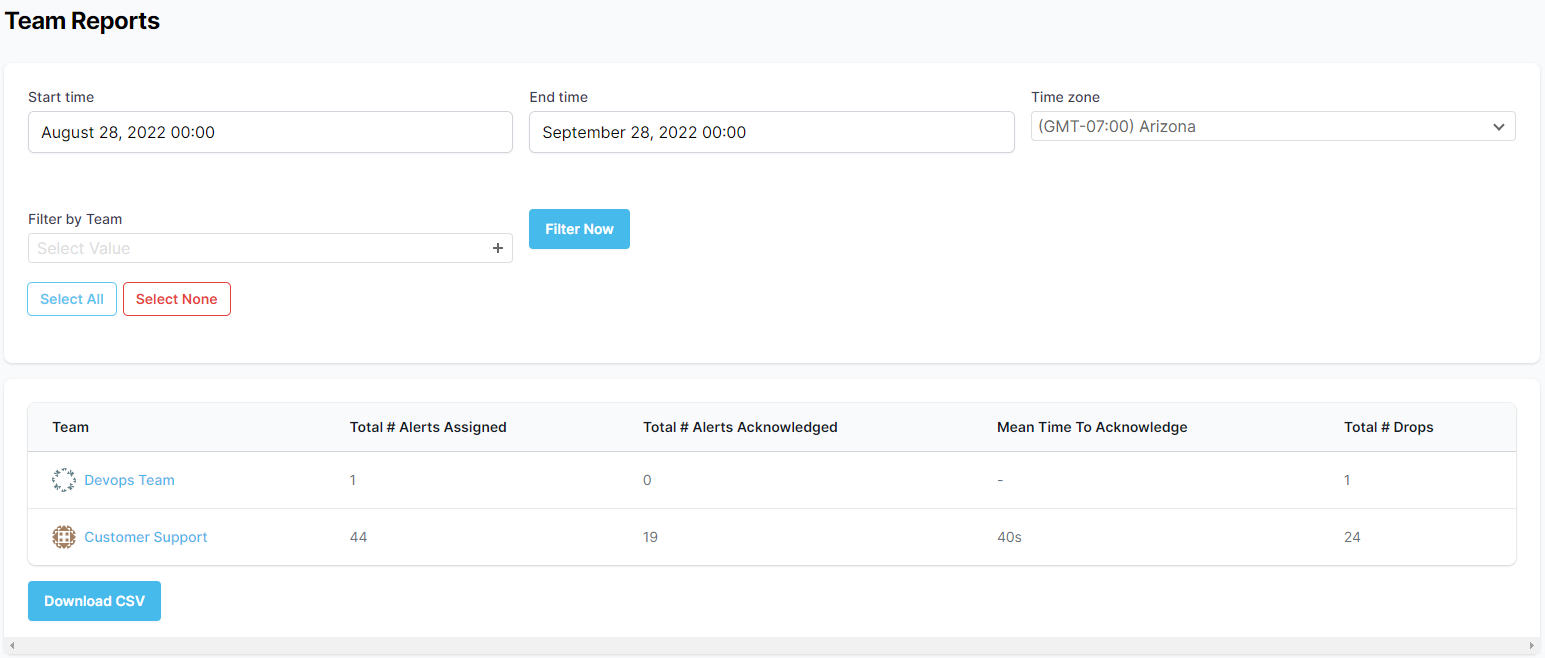
Teams Reports

  • Total number of alerts

  • Total number of alerts acknowledged

  • Total number of alerts dropped

  • A team's mean time to acknowledge

Additional Options

  • Filter by Team - Filter by selected teams (leave blank for all).

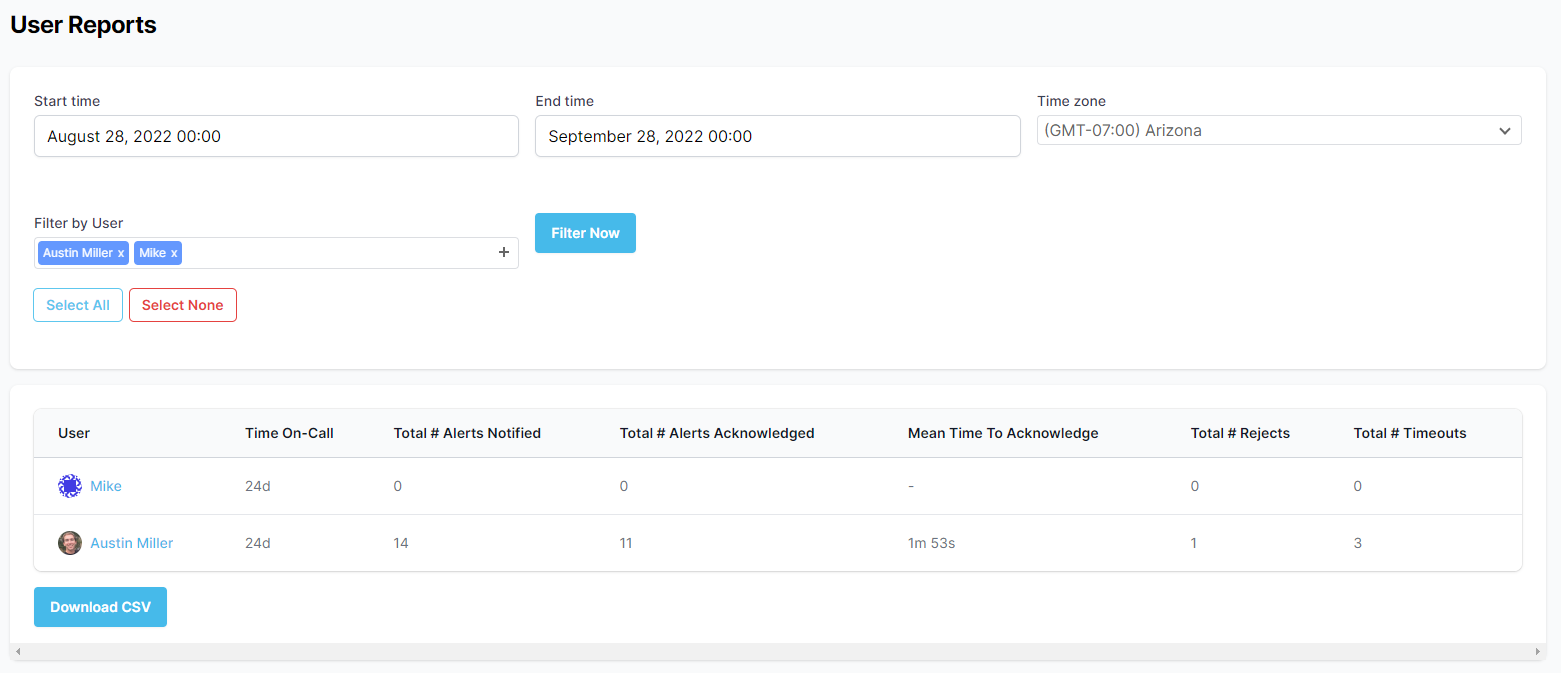
Users Reports

  • Total Time On-Call (total man days, overlapping events do not count twice).

  • Total number of alerts the user was notified about.

  • Total number of alerts the user acknowledged.

  • Mean time to acknowledge.

  • Total number of rejects.

  • Total number of timeouts.

Additional Options

  • Filter by User - Filter by selected users (leave blank for all).

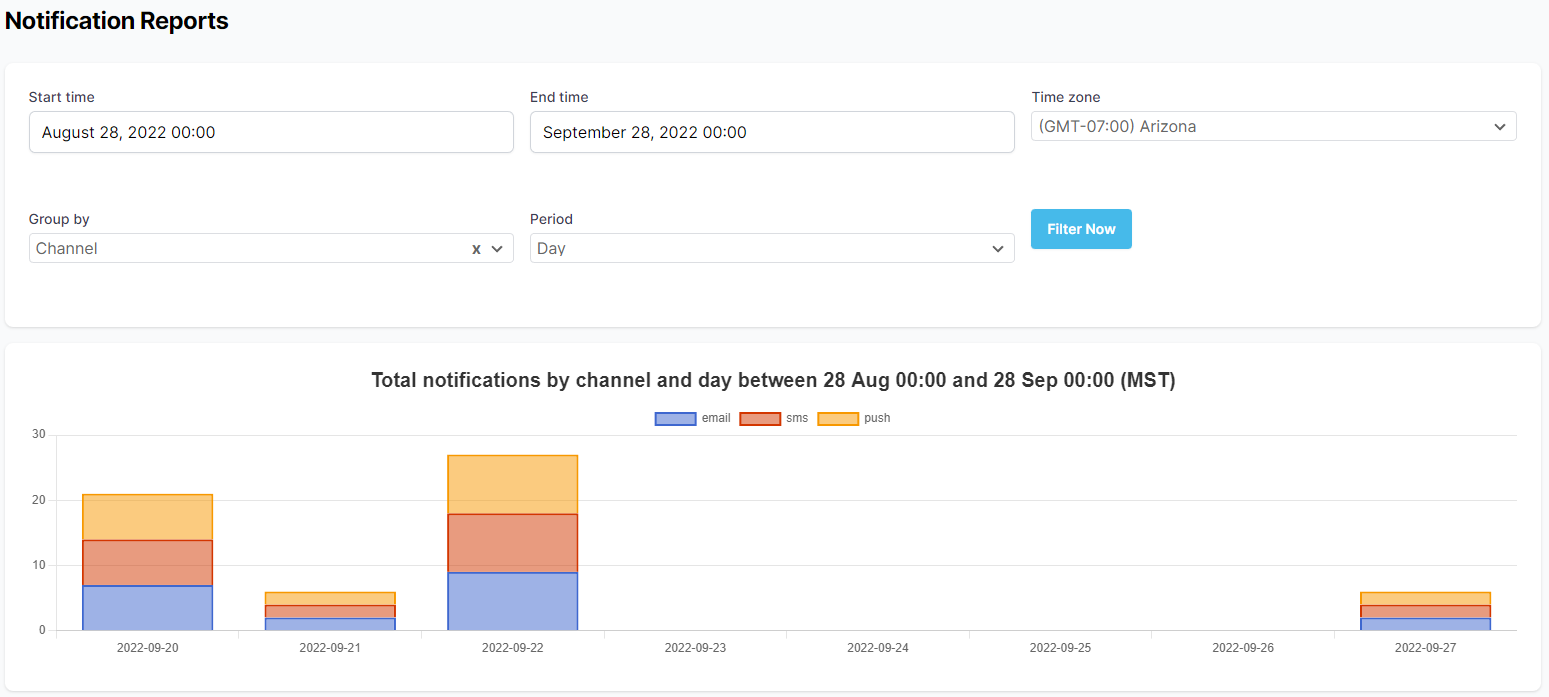
Notifications Report

Additional Options

  • Group by - Options: channel, provider, status.

  • Period - Unit of time bucket the x-axis.

The report can show volume (total) alerts over a specified period of time.
The reports shows (on a per team basis):

The report shows (on a per user basis):

The report can show volume (total) of notifications for a period of time.
alerts
teams
users
notifications
Download CSV button for reports
Alerts Report
Teams Report
Users Report
Notifications Report
Download CSV button for reports.
alert reports
team reports
user reports
notification reports